
Ecommerce Markup vs Margin: Why Confusing the Two Is Costing You Money
If you have ever priced a product by adding 50 percent to your cost and expected a 50 percent profit margin, you already fell into the trap this article exists to fix. Markup and margin sound like the same idea wearing two different hats. They are not. They are two different math problems that happen to use the same two numbers, and mixing them up is one of the quietest ways e-commerce sellers underprice their own products. Markup is profit calculated against your cost. Margin is profit calculated against your selling price. Same dollar of profit, two different denominators, two different percentages. That single sentence explains more pricing mistakes in e-commerce than almost any other concept in small business accounting. Let’s break down why it matters and where it actually bites people. Markup Explained: How Much Are You Adding to Cost? Markup answers the question: how much did I add on top of what this cost me? Formula: Markup percent = (Selling price minus Cost) divided by Cost, times 100 Say you buy a product for $20 and sell it for $30. Your profit is $10. Divide that $10 by your $20 cost, and you get 50 percent. That’s your markup. It’s the amount you tacked on relative to what you paid. Suppliers, manufacturers, and wholesalers tend to talk in markup because their world revolves around cost. It’s a natural language for people thinking from the production side outward. Margin Explained: How Much Profit Do You Keep? Margin answers a different question: of every dollar a customer hands me, how much is actually profit? Formula: Margin percent = (Selling price minus Cost) divided by Selling price, times 100 Same example. $20 cost, $30 selling price, $10 profit. This time divide that $10 by the $30 selling price, and you get 33.3 percent. Not 50 percent. That gap between 50 and 33.3 is the entire reason this topic trips people up. Accountants, investors, and anyone reading a profit and loss statement tend to think in margin, because margin tells you what share of revenue survives after cost. It’s usually a better single number for gauging business health, since revenue, not cost, is what actually flows into your bank account first. Markup vs Margin: The Numbers Side by Side This is the part people are really searching for. Here’s how markup and margin line up at matching profit levels. Markup Percent Margin Percent 10% 9.1% 20% 16.7% 25% 20% 33.3% 25% 50% 33.3% 66.7% 40% 100% 50% 150% 60% 300% 75% Notice the pattern. Markup will always read higher than margin at the same underlying profit, and the gap widens as the percentages climb. A 100 percent markup, which sounds like doubling your money, only produces a 50 percent margin. A lot of sellers set pricing goals in markup language and then get quietly disappointed when their actual margin, the number that determines whether the business is healthy, comes in lower than expected. How To Convert One Into The Other You don’t need to memorize the table. Two formulas cover every scenario. Markup to margin: Margin = Markup divided by (1 plus Markup) Margin to markup: Markup = Margin divided by (1 minus Margin) Plug in decimals, not percentage signs, and multiply the result by 100 at the end. A 50 percent markup becomes 0.5 divided by 1.5, which is 0.333, or 33.3 percent margin. Run it the other direction, and a 25 percent margin becomes 0.25 divided by 0.75, which is 0.333, or 33.3 percent markup. Same relationship, mirrored. How to Price a Product for a Target Margin Say your landed cost on a product, meaning what you paid the supplier plus inbound freight and packaging, comes to $18. You’ve decided you need a 40 percent margin on this item to make the numbers work. That’s the whole workflow. Decide the margin you need first, convert it to a markup, then apply that markup to your cost to land on a selling price. Which Ecommerce Costs Can Shrink Your Margin? The formulas above only work as well as the cost figure you plug into them, and that’s where a lot of e-commerce sellers go wrong. It helps to separate cost into two different buckets. Landed or product cost is what typically belongs in the markup and margin formulas: what you paid your supplier, plus inbound freight, duties, and packaging to get the product ready to sell. This is your baseline cost of goods sold. Selling costs sit outside the basic markup and margin math entirely. Payment processing fees, marketplace or platform commissions, advertising spend, and the cost of returns and refunds are real and often significant, but they’re not part of the standard markup or margin formula. They get deducted separately, further down the income statement, which is why a product with a healthy margin on paper can still lose money once those additional costs are factored in. If you’re setting a target margin using only your landed cost and never checking what’s left after platform fees, ad spend, and returns, the margin you think you have and the margin that actually lands in your bank account can be two very different numbers. Contribution margin is the metric built specifically to answer that second question, since it factors variable selling costs back in. This distinction also matters when you run a sale. A seller aiming for a 40 percent margin might assume a 20 percent off promotion still leaves comfortable room. But a discount calculated off of the selling price eats into margin at a steeper rate than it looks like against markup, and that’s before accounting for the ad spend usually driving the promotion in the first place. Running a sale without first checking the math is a common way a “profitable” product turns into a break-even one for the duration of the promo. Markup or Margin: Which Should Ecommerce Sellers Use? Use markup when you’re setting an initial price from cost. It’s the natural tool for the moment
Accrued Advertising Expenses: How to Record and Calculate Them

If you run ads for an e-commerce store, you already know the annoying truth about ad platform billing: the money leaves your account on a schedule that has nothing to do with your accounting calendar. Meta typically bills every 30 days or once you cross a spend threshold. Google Ads can bill daily, weekly, or monthly depending on how the account is configured. TikTok and Amazon Ads each run their own cycle too. None of them care that your month ends on the 30th. That mismatch is exactly why accrued advertising expenses exist as a line item. Without one, your books understate what the business actually spent to acquire customers that month, and your numbers quietly drift out of sync with reality. What Is an Accrued Advertising Expense, and How Is It Different From Accounts Payable? An accrued advertising expense is advertising cost your business has incurred but hasn’t yet been billed for. You know the spend happened because you can see it live on the platform dashboard. You just don’t have an invoice yet, which means there’s nothing to enter as a normal bill. Is accrued advertising expense a liability? Yes. It’s classified as a current liability on the balance sheet, sitting alongside accounts payable, accrued payroll, and other short-term obligations. The distinction people mix up most is accrued advertising versus accounts payable, and it’s worth being precise about it: Once the invoice lands, the accrual gets reversed and the real amount moves into accounts payable until it’s paid. They’re not interchangeable categories; they’re two stages of the same expense moving through your books. This all sits under the broader concept of accrual accounting, which recognizes expenses when they’re incurred rather than when cash actually leaves the bank, a concept known as the matching principle. Here, we’re staying narrow and practical: how advertising accrual accounting actually plays out for e-commerce sellers running paid ads across multiple channels. Why Ecommerce Sellers Need to Accrue Unbilled Ad Spend A service business with a flat monthly ad retainer barely needs to think about this. An e-commerce store running dynamic Meta and Google campaigns is a different animal. Spend fluctuates daily based on performance, promotions, and inventory pushes, and different platforms invoice on different clocks. A brand spending $40,000 a month across three channels can easily have $8,000 to $12,000 sitting unbilled at any given moment, spread across billing cycles that don’t line up with each other or with your close date. If that unbilled chunk never hits your books, your income statement understates expenses in the month the spending actually happened, then overstates them the following month once the invoice finally lands. Repeat that pattern for a year, and your monthly margin numbers stop reflecting reality, which matters if you’re using them to guide inventory, hiring, or ad budget decisions, or if you’re heading into a valuation event where a buyer’s diligence team is likely to flag inconsistent expense timing as a red flag. Accrued Advertising Expense Journal Entry: How to Record It Here’s the standard adjusting journal entry at month end, before the invoice arrives: Example: your Meta Ads dashboard shows $6,200 in spend that hasn’t been billed yet as of month end. Account Debit Credit Advertising Expense $6,200 Accrued Advertising Payable $6,200 The following month, once the real invoice arrives, you reverse the accrual and record the confirmed liability: Some businesses automate this with a standing reversing entry that flips automatically on the first day of the next period rather than reversing it manually once the invoice shows up. Either approach works; what matters is that the estimate doesn’t stay on the books alongside the real invoice, which is where double counting creeps in. If your estimate was close, the reversal nets out cleanly. If it wasn’t, book a small true-up entry to Advertising Expense for the difference: debit if you underestimated, credit if you overestimated. How to Estimate Your Advertising Accrual Each Month This is the part most explainers skip, and it’s the part that actually matters day to day. You’re not guessing blind. Every ad platform gives you a live spend dashboard, and estimating accrued advertising costs is really just a matter of pulling the right numbers before you close the books: Quick example: Meta shows $4,100 unbilled, Google shows $2,900 unbilled, and your agency’s management fee, billed the following month based on total spend, is estimated at $700. Your total accrual for the month is $7,700. Where Accrued Advertising Costs Appear on Your Financial Statements Statement Where it shows What it represents Income Statement Advertising Expense (operating expenses) The full cost incurred during the period, accrued and invoiced combined Balance Sheet Accrued Liabilities (current liabilities) The unpaid, unbilled portion still owed as of the reporting date The expense hits the income statement in the month it was actually incurred, regardless of when the invoice arrives. The liability stays on the balance sheet until it’s either paid or replaced by a confirmed accounts payable entry. Common Mistakes in Advertising Expense Accounting Underaccruing because only one channel gets checked. A store running Meta and Google will sometimes accrue the Meta number and forget Google entirely, usually because Google’s billing feels less visible on a day-to-day basis. Forgetting to reverse the entry. If last month’s accrual never gets reversed once the real invoice comes in, you end up double counting the expense. This is one of the most common and most expensive errors in advertising accrual accounting, and it quietly inflates expenses month after month until someone finally reconciles the account. Treating agency fees and platform spend as one lump sum. They’re often billed on different schedules by different parties, so they sometimes need separate accrual lines instead of one blended guess. Applying this under cash basis accounting. If your business keeps books on a cash basis, you generally don’t need this entry at all, since a cash basis recognizes expenses when paid, not when incurred. This trips up a fair number of smaller sellers who apply accrual advice
Perpetual Inventory Method: Why It Shapes Your Financial Forecast

Ask most e-commerce founders how they know their inventory value on any given day, and you get a shrug. They know what they counted last quarter, and they know roughly what came in and went out since then. That gap between “roughly” and “exactly” is the reason the perpetual inventory method exists, and it is also a big part of why so many e-commerce financial forecasts drift away from reality within a few months. This guide covers what the perpetual inventory method actually is, the formula behind it, how FIFO and LIFO change the numbers it produces, and why the costing method you use matters far more to your financial forecasting than most accounting explainers admit. What Is the Perpetual Inventory Method The perpetual inventory method is an inventory accounting system that updates inventory quantities and recognizes the related cost of goods sold as each transaction happens, based on the costing method a business has adopted. Every sale, purchase, and return is recorded in the system in close to real time, rather than being reconciled once at the end of a period. This sits in contrast to the periodic inventory method, where a business only knows its inventory value after a physical count, and cost of goods sold is calculated as a single figure at period end rather than tracked transaction by transaction. Periodic accounting worked fine for a small shop with a few hundred SKUs and a cash register. It becomes impractical fast for an e-commerce business selling across a website, Amazon, and a wholesale channel, where a single day can generate thousands of transactions that each need to hit inventory at the correct cost. Most modern e-commerce platforms, and most inventory or order management tools that connect to Shopify, Amazon, or a warehouse management system, are built around perpetual inventory logic by default. Every sale decrements stock. Every purchase order receipt increases it. Inventory accounting under US GAAP is governed broadly by ASC 330, and while the standard does not mandate a specific system, perpetual tracking is what makes it realistic to apply a costing method consistently at the volume most e-commerce businesses operate at. Related reading: for the accounting logic that governs which costing rules a system like this can apply, see our guide to FIFO vs LIFO for e-commerce businesses. Perpetual vs Periodic Inventory: A Quick Comparison Factor Perpetual Inventory Periodic Inventory Update frequency Continuous, updated with every transaction Updated only at the end of a set period COGS recognition Recognized transaction by transaction as sales occur Calculated once, as a plug figure, at period end Inventory visibility Real-time inventory value at any point Unknown between physical counts Dependence on physical counts Physical counts confirm and adjust the running balance. Physical counts are the only source of the balance. Ecommerce suitability Built for high transaction volume and multichannel selling Workable for very low-volume, single-channel sellers The Perpetual Inventory Method Formula The foundational inventory equation is this: Beginning Inventory + Purchases − Cost of Goods Sold = Ending Inventory It is worth being precise about what this formula is and is not. It is a reconciliation equation, a way of confirming that the inventory value on the books ties out logically over a period. It is not a literal description of how a perpetual system processes each individual transaction. In practice, a perpetual system recognizes COGS at the moment of each sale, using the unit cost assigned under the company’s selected costing method, and the running inventory balance simply reflects the cumulative result of those entries. The formula above is the summary check, not the mechanism. That per-unit cost is where the accounting gets interesting, because it depends on two things: the landed cost recorded when the inventory was received and the cost flow assumption, FIFO or LIFO, applied when a unit is sold. Landed cost typically includes the product’s purchase price plus the freight, duty, and other directly attributable costs a company’s accounting policy treats as part of getting that inventory ready for sale. Not every cost incurred around a shipment is automatically capitalized this way. Which specific charges get included is a policy decision made with an accountant, applied consistently, rather than a fixed universal rule. FIFO vs LIFO: What They Actually Assume FIFO and LIFO are cost flow assumptions, not descriptions of how physical inventory moves off a shelf. This distinction trips up a lot of founders. A business can use FIFO for accounting purposes while its warehouse team ships whatever unit is closest to the door. The costing method determines which recorded cost gets matched to a sale in the books. It does not dictate, and is not required to match, the literal physical sequence in which units leave the warehouse. FIFO Perpetual Inventory Method FIFO stands for first in, first out. Under the FIFO perpetual inventory method, the accounting system assumes the oldest costs on the books are the ones matched to the next sale, and it assigns that cost the moment the sale is recorded, not at period end. Here is where it matters practically. Say a business bought one hundred units at eight dollars each in March, then another hundred at ten dollars each in June after a supplier price increase. Under FIFO perpetual, the next hundred units sold after June are still costed at eight dollars, because the March cost layer is the one assumed to be consumed first. Only once that layer is exhausted does the system begin drawing from the ten-dollar layer. LIFO Perpetual Inventory Method LIFO stands for last in, first out, and the assumption runs in the opposite direction. Under the LIFO perpetual inventory method, the most recently recorded cost layer is matched to each sale as it happens. Using the same example, once the ten-dollar June layer is on the books, any sale processed under LIFO perpetual draws from that layer first, regardless of which physical units actually ship. During a period of rising supplier costs, this produces a higher recognized COGS and
Ecommerce Contribution Margin: How to Calculate It and Use It

Revenue can grow every month, and a store can still be quietly losing money on every order. That gap between “sales are up” and “cash in the bank is down” is usually explained by one number founders don’t look at closely enough: contribution margin. It’s one of the first metrics we rebuild when we take over the books for a new e-commerce client, because it’s usually the fastest way to find out why a “profitable” P&L doesn’t match what’s actually happening in the bank account. If you’ve only ever tracked gross margin or watched top-line revenue and called it a day, this is the metric that tells you which orders, products, and channels are actually worth running. Here’s how to calculate it correctly, which ecommerce costs are genuinely variable versus fixed, and how to use the number for pricing and ad spend decisions instead of just reporting on it after the fact. What Contribution Margin Actually Means Contribution margin is what’s left from a sale after you subtract the costs that move directly with that order. Not rent, not salaries, not your Shopify subscription. Just the costs tied to producing, fulfilling, and selling that specific unit. Contribution Margin = Net Revenue − Variable Costs “Net revenue” here means revenue after discounts and refunds, before any variable costs are subtracted, not your Shopify dashboard’s gross sales figure. That distinction matters more than it sounds like it should, because inflated top-line revenue is exactly what makes a store look healthier than it is. Whatever is left over contributes toward covering fixed costs and, once those are covered, becomes actual profit. Because it’s calculated per order, per unit, or per SKU, it’s a far more useful day-to-day decision-making tool than a blended, company-wide margin figure that only gets reviewed once a month. Contribution Margin vs Gross Margin This is the single most common point of confusion, so it’s worth separating cleanly. Gross margin = Revenue minus COGS (product cost, and usually inbound freight). Nothing else. Contribution margin = Revenue minus every variable cost associated with the sale, which includes COGS but also extends to shipping, payment processing, fulfillment, and, in most DTC reporting, the marketing cost attributed to acquiring that order. Two stores can post identical gross margins and have completely different contribution margins, because one is spending heavily on paid acquisition and the other is growing mostly through organic and email. Gross margin won’t surface that difference. Contribution margin will. Think of it this way: gross margin tells you whether the product itself is priced correctly. Contribution margin tells you whether the business model holds up once you account for what it actually costs to acquire, fulfill, and service that order. Variable, Fixed, and the Semi-Variable Costs That Trip People Up Most DIY calculations go wrong in one of two directions: people only subtract COGS, which just reproduces gross margin with extra steps, or they subtract costs that don’t actually scale with volume, which understates the real number. Genuinely variable costs in an ecommerce order typically include: A few costs are semi-variable, meaning part of the cost is fixed and part scales with volume, and treating them as purely one or the other will distort your number: What stays fixed no matter what: warehouse lease, salaried payroll, software subscriptions, insurance, and general overhead. If a cost doesn’t change when your sales volume changes, it’s fixed, full stop. Returns and chargebacks deserve separate treatment rather than a single line item. A refund typically costs you the product (if not resalable), return shipping, and restocking labor. A chargeback costs you the chargeback fee on top of the lost merchandise, with no product recovery at all, since the customer usually keeps the item. For forecasting and pricing, it’s reasonable to model these as a proportional allocation based on your historical return and chargeback rate. But your actual, recorded contribution margin for a given period should reflect the returns and chargebacks that were genuinely incurred that period, not a smoothed estimate. Mixing the two approaches is a common way this metric quietly drifts from reality. Worked Example Say you sell a skincare product at $40 per unit, with a 3% historical return rate. Cost component Amount COGS $9.00 Packaging $1.50 Fulfillment (per-unit portion) $6.00 Payment processing (2.9% + $0.30) $1.46 Attributed ad spend $12.00 Allocated return/chargeback cost (3% rate) $0.50 Total variable cost $30.46 Contribution Margin per unit = $40.00 − $30.46 = $9.54 Contribution Margin Ratio = $9.54 ÷ $40.00 = 23.9% Now apply that to break-even. If this product’s share of monthly fixed costs, rent, salaries, software, and other overhead works out to $18,500, you’d need: Break-Even Units = Total Fixed Costs ÷ Contribution Margin Per Unit: $18,500 ÷ $9.54 ≈ 1,940 units per month That’s a concrete, trackable target instead of a vague “we need more sales.” It also tells you immediately what a $2 increase in per-unit ad spend would do to that number, which is the kind of question a blended monthly margin figure can’t answer quickly. CM1, CM2, CM3: A Useful Convention, Not a Universal Standard There’s no single industry-wide definition of these tiers, so if you see them used differently elsewhere, that’s not necessarily wrong, it’s a different convention. One version commonly used in e-commerce finance: Whichever convention you use, the point is consistency: define what belongs in each tier once, document it, and apply it the same way every month so the numbers stay comparable. What “Good” Actually Depends On Published benchmark ranges for contribution margin by category circulate widely, but most aren’t sourced from audited data and vary enormously depending on what a given source counts as a variable cost. Treat any external benchmark as a rough sanity check, not a target. A more reliable approach is building your own baseline: calculate CM1 through CM3 for your current SKU lineup, then track the trend over time. If CM2 is shrinking quarter over quarter while revenue grows, that’s a signal worth investigating regardless of what a published
Ecommerce Financial Forecasting: How to Build a Budget Forecast

Most e-commerce founders do not fail because they lack sales. They fail because the money moves differently than they expected it to, and by the time they notice, the gap is already three months wide. Financial forecasting is the discipline that closes that gap before it opens, and a budget forecast is the specific tool that turns a vague sense of “we should be fine” into a number you can actually plan against. This guide walks through what e-commerce financial forecasting really involves, how it differs from a plain budget, and a repeatable process for building a budget forecast that survives contact with a real sales channel, real returns, and a real payout schedule. What Ecommerce Financial Forecasting Actually Means Financial forecasting is the process of predicting a company’s future revenue, costs, and cash position using historical performance, known assumptions, and market signals. In an e-commerce context, that means something more specific than the generic definition suggests. A software company forecasts subscription revenue that renews on a predictable schedule. An e-commerce business forecasts a business where revenue depends on traffic, conversion rate, average order value, channel mix, and a seasonality curve that can swing thirty or forty percent between a slow month and Black Friday week. Costs are equally uneven: inventory has to be purchased and paid for weeks or months before it sells, marketing spend can be turned up or down almost daily, and payment processors hold funds on their own schedule rather than yours. That last point trips up more founders than any other. Shopify Payments typically settles within one to three business days, but Amazon pays out roughly every two weeks, and some marketplaces run on a thirty-day cycle. If your budget forecast assumes revenue equals cash the moment a sale happens, your bank balance will consistently disagree with your spreadsheet, and that disagreement compounds every month you leave it unmodeled. Budget vs Forecast: A Distinction Worth Getting Right These two words get used interchangeably, and that habit causes real damage. A budget is a plan. It is the number you set at the start of a period, usually a quarter or a year, based on your goals and available resources. A forecast is a prediction. It updates continuously as new information arrives, and its entire job is to reflect reality as closely as possible, even when reality contradicts the original plan. The practical implication: your December budget might say you will spend eighty thousand dollars on paid ads. Your November forecast, built from actual October performance, might tell you that eighty thousand will only produce sixty percent of the sales you were counting on because your blended CAC has crept up. A healthy ecommerce finance process uses the forecast to decide whether to hold the budget, cut it, or reallocate it, rather than defending a number that was accurate the day you wrote it and stale two months later. The Core Inputs Every Ecommerce Forecast Needs A forecast is only as good as its assumptions, and vague assumptions are where most spreadsheets quietly go wrong. Six inputs carry almost all the weight. Historical sales data. Pull at least twelve to eighteen months so seasonality shows up clearly rather than looking like random noise. A single strong month can look like a trend if you only have three months to compare it against. Channel mix. Website, Amazon, retail wholesale, and marketplace sales each carry different margins, different payout timing, and different fee structures. Blending them into one revenue line hides where the actual profit sits. Average order value and conversion rate. These two numbers, multiplied by projected traffic, produce your revenue forecast. Small movements compound quickly. A five percent AOV increase from a bundling strategy behaves very differently in the model than a five percent traffic increase, even though both look similar on the top line. Return and chargeback rate. Apparel businesses routinely see return rates above twenty percent. If your forecast books gross revenue without netting this out, projected cash will overstate reality every single month, and the error grows during high-return categories like holiday gifting. Cost of goods sold and freight. COGS as a percentage of revenue should be tracked by product line, not averaged across the whole catalog, because a shift in your bestseller mix can quietly compress margin even while revenue climbs. Marketing spend and CAC. Rather than budgeting marketing as a flat percentage of revenue, tie it to customer acquisition cost payback. If your CAC payback period is running past six months, that is a signal to slow spend before the cash strain shows up elsewhere. Building the Budget Forecast: A Working Process Step 1: Choose your forecasting method Two approaches dominate e-commerce. A top-down forecast starts with a total revenue target and works backward into channel and product assumptions, useful for a founder setting an ambitious growth goal. A bottom-up forecast starts with unit-level drivers, traffic times, conversion times, and AOV by channel and builds up to a total. Bottom-up is slower to construct but far more defensible when you need to explain a variance to a lender, investor, or your own team. Step 2: Build the revenue layer first Segment revenue by channel and, where possible, by product category. Apply your historical seasonality index to each segment rather than to the total, since a wholesale account and a Black Friday DTC spike do not move together. Step 3: Layer in cost drivers against revenue, not against time COGS and shipping should scale with units sold, not sit as a flat monthly number. Fixed costs like software subscriptions and salaries stay flat and get modeled separately so a founder can see, at a glance, how much revenue is required to cover fixed overhead before any profit exists. Step 4: Model cash separately from revenue This is the step most templates skip, and it is the one that prevents surprises. Apply your actual payout timing per channel, subtract expected returns and chargebacks, and lay the result against your accounts payable schedule
Ecommerce Chargeback Guide: Stop Losses & Win Disputes

A chargeback rarely announces itself politely. It shows up as a deduction from your payout, a fee attached to it, and a short window to prove your case before the money is gone for good. Chargeback management is the discipline of preventing these forced reversals where possible, tracking them closely, and formally contesting the ones that land, and for most e-commerce operators it sits somewhere between routine operations and a genuine threat to the business if ignored. This guide covers what a chargeback actually is, how it differs from a dispute or a refund, what counts as a healthy chargeback rate under current network rules, and the practical steps for prevention, reduction, representment, and ongoing monitoring. What a Chargeback Actually Is A chargeback happens when a cardholder contacts their issuing bank to reverse a transaction rather than requesting a refund from the merchant directly. The bank pulls the disputed funds back from the merchant’s account, often before the merchant even hears about it, and the merchant then has a limited window, commonly around thirty to forty-five days depending on the network and reason code, to respond with evidence if they want the money back. This is not the same as a refund. A refund is voluntary and merchant-initiated. A chargeback is involuntary and bank-mediated and comes with a processing fee attached regardless of the outcome. So a merchant can lose the sale and the goods and still pay a fee on top, which is exactly why prevention tends to pay off far more than fighting disputes after the fact. Disputes vs Chargebacks: A Distinction Worth Making People use these two terms interchangeably, and that causes real confusion when a team is trying to diagnose what happened. A dispute is the umbrella term for any formal complaint a cardholder raises about a transaction. A chargeback is one possible outcome of a dispute, specifically the reversal itself once the issuing bank has processed it. Some disputes never become chargebacks at all. Alert networks such as Ethoca and Verifi’s Cardholder Dispute Resolution Network notify a merchant the moment a cardholder contacts their bank, often hours before a formal chargeback is filed. A merchant who refunds during that window resolves the complaint without it ever counting against their chargeback ratio. This is why response speed matters as much as evidence quality: the fastest path to a lower chargeback rate is often catching disputes before they escalate, not fighting them after they do. What Counts as a Healthy Chargeback Rate Chargeback rate, also called chargeback ratio, is the number of chargebacks divided by the number of transactions over a given period, usually a rolling month. Card networks run their own monitoring programs, and the rules have gotten notably stricter in the last couple of years. Visa replaced its older Dispute Monitoring and Fraud Monitoring programs with a single combined program, the Visa Acquirer Monitoring Program, which counts both fraud reports and disputes together against one ratio. That threshold has tightened significantly and now sits well under two percent for merchants who process meaningful volume, with penalties charged per flagged transaction once a merchant is enrolled. Mastercard runs a tiered system: merchants crossing roughly 1.5 to 3 percent with a minimum chargeback count are flagged as Excessive, and merchants above that with higher volume move into a stricter High Excessive tier carrying steeper monthly fines. American Express uses a lower single threshold, generally flagging merchants whose ratio sustains above roughly one percent for several consecutive months. Network Typical monitoring trigger What happens once flagged Visa (Acquirer Monitoring Program) Combined fraud and dispute ratio in the low single digits, with a minimum monthly dispute count Per transaction fees on flagged disputes, acquirer-level scrutiny Mastercard (Excessive / High Excessive) Roughly a 1.5% to 3%+ ratio, tiered by chargeback count Monthly fines that escalate the longer a merchant stays enrolled American Express Ratio sustained above roughly 1% for consecutive months Excessive chargeback fees, closer account review These figures move periodically as networks adjust their rules, so treat them as directional rather than exact, and confirm current numbers with your processor or acquirer before setting internal targets. As a practical benchmark, most healthy e-commerce merchants selling physical goods aim to stay meaningfully below one percent, while subscription businesses, digital goods, and travel tend to run higher simply because of billing confusion and larger ticket sizes. The Real Cost of a Chargeback The processor fee is the visible cost, usually somewhere in the fifteen- to one hundred-dollar range depending on the processor and the merchant’s risk history. But that fee is rarely the biggest line item. Once you add the lost merchandise, the original processing fee that is not refunded, and the staff hours spent gathering evidence, industry research on fully loaded chargeback costs has put the average total closer to over a hundred dollars per dispute, sometimes several times the value of the original transaction on smaller orders. That multiplier is why a merchant with a thin margin can be profitable on paper and still bleed cash through chargebacks quietly, especially if fraud attempts cluster around a bestselling, low-cost item. Chargeback Prevention: Stopping Disputes Before They Start Prevention lives upstream of the pain point, and it is the layer most merchants underinvest in because nothing about it feels urgent until a spike hits. A practical prevention checklist: Chargeback Reduction: Fixing the Root Causes Reduction is broader than fraud tooling. A large share of what gets coded as fraud is actually a cardholder who did not recognize a charge on their statement and assumed the worst, often called friendly fraud or first-party misuse. Where to focus: None of this is glamorous, but it is where most of the actual reduction happens in practice, far more than any single piece of fraud software. Chargeback Representment: How to Fight Back and Win Representment is the formal process of submitting evidence to reverse a chargeback. Done well, it recovers real revenue. Done poorly or not at all, it quietly caps your recovery rate
Chargeback Accounting: The Ecommerce Guide to Recording Disputes
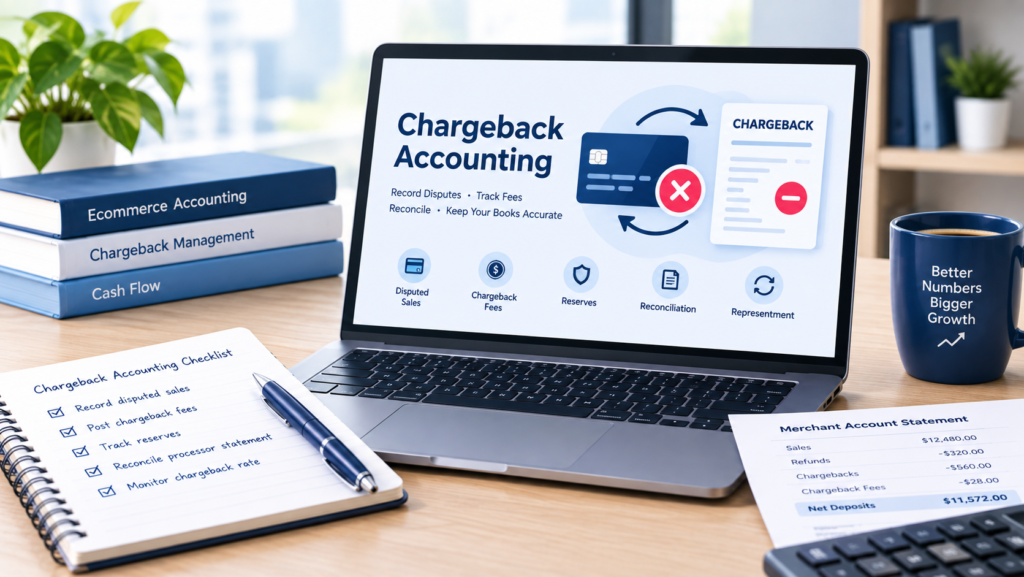
A chargeback shows up in your merchant account statement looking almost identical to a refund. It isn’t one, and treating it like one is probably the single most common mistake I see when reviewing an e-commerce client’s books for the first time. A refund is something you initiate. A chargeback is something that happens to you. The customer disputes the charge directly with their card issuer, the disputed funds get pulled from your merchant account, and you’re typically notified after the reversal has already happened rather than asked in advance. That difference is exactly why refunds and chargebacks need separate accounting treatment, not a shared line item. Chargeback vs. Refund: What’s the Accounting Difference? Refund Chargeback Who initiates it The merchant The cardholder, through their bank Fee attached Usually none Yes, charged by the processor regardless of outcome. Merchant control Full Limited, unless contested through representation Recorded as Contra-revenue Contra-revenue plus a separate fee expense Reversible Not applicable Yes, if the merchant wins representment If a chargeback is being recorded as a plain refund in your books, two things are happening quietly. Your dispute-related costs are understated, and you’ve lost the ability to see your actual chargeback rate as its own number instead of a figure buried inside a blended returns account. Chargeback Accounting vs. Management: What’s the Difference? These two terms get used almost interchangeably, and that’s part of why the accounting side often gets neglected. Chargeback management is operational: fraud screening, clear product descriptions, responsive customer service, and accurate tracking information, all aimed at reducing how many disputes happen in the first place. Chargeback accounting is the separate discipline of recording, reconciling, and reporting the disputes that do occur, regardless of whether your management practices are strong or weak. A business can have excellent chargeback management and still have poor chargeback accounting, usually because the bookkeeping habit of lumping disputes into general returns formed early and never got revisited. The two need to work together, but fixing one doesn’t fix the other. How to Record a Chargeback in Ecommerce Accounting A chargeback typically triggers two separate financial events, and the entries should reflect both rather than netting them into one line. First, the disputed sale gets reversed. This reduces revenue the same way a return would, and for most ecommerce businesses the offsetting side is Cash or a payment processor clearing account, not Accounts Receivable, since card sales are rarely invoiced. Accounts Receivable becomes relevant mainly for B2B or ACH based transactions where a formal receivable existed. A typical entry, assuming the processor deducts the amount directly from your payout: Debit: Chargebacks (a dedicated contra revenue account, separate from general Sales Returns and Allowances) — transaction amount Credit: Cash or Merchant Clearing Account — transaction amount Second, a chargeback fee is charged by the processor, independent of the disputed amount and independent of whether you eventually win the dispute. Debit: Chargeback Fees Expense — fee amount Credit: Cash or Merchant Clearing Account—fee amount Keeping chargebacks in their own contra revenue account rather than folding them into general returns costs nothing to set up and means your chargeback rate is visible on demand instead of something you have to reconstruct at year end. Chargeback Fees: Where They Belong on the P&L The disputed transaction amount belongs in contra revenue, reducing net sales. The chargeback fee is a separate cost of doing business and belongs in operating expenses, usually grouped with payment processing or merchant fees rather than mixed into the revenue reversal itself. The disputed transaction amount belongs in contra revenue, reducing net sales, while the chargeback fee is a separate operating expense. This distinction matters when reviewing your e-commerce P&L. Processor fee amounts vary meaningfully by platform, card network, and your account’s risk history, and the specific dollar figure charged by Stripe, Shopify Payments, or PayPal should be confirmed directly against your own processor agreement rather than assumed. What matters for your books is the separation: one number tells you how much revenue was lost, the other tells you what it cost you to have the dispute happen at all. Collapsing both into a single expense line understates gross margin in a specific way. It makes the cost of doing business look higher than it is while masking a revenue quality problem that’s actually driving the trend. Reserves and Chargeback Allowances: Two Different Things This is where I see the most confusion, and it’s worth separating clearly. A processor holdback or rolling reserve is cash your payment processor withholds from your payout in anticipation of future disputes. It is still your asset. It belongs on the balance sheet, typically as a restricted cash asset or a receivable from the processor, not as an expense. I’ve seen founders write off a growing reserve balance because it feels like lost money, when it’s actually sitting with the processor waiting to be released once the risk period passes. A chargeback allowance is a different concept entirely, relevant mainly to businesses on accrual basis accounting with a meaningful and fairly predictable dispute rate. Similar to an allowance for doubtful accounts, it’s an estimated contra revenue reserve booked at period end based on historical chargeback patterns, intended to match anticipated future disputes against the revenue that generated them. Most small ecommerce sellers don’t need this level of accrual sophistication, but it becomes relevant once dispute volume is material enough to distort period-over-period revenue comparisons, or once a lender or investor expects GAAP aligned reporting. Chargebacks and Cash Flow Because a chargeback pulls cash after the original sale was recorded, and often after inventory is already shipped, it creates a timing gap between reported revenue and actual cash collected. Revenue gets recognized in one period. The reversal can land weeks later, sometimes crossing into the next reporting period entirely. For a business with a climbing chargeback rate, this shows up as operating cash flow that consistently lags behind net income. That gap isn’t always an inventory timing issue, and it’s worth checking chargeback
Quality of Earnings: What Ecommerce Sellers Actually Need to Know

If you’re an ecommerce founder who has ever had a broker, lender, or buyer mention “we’ll need a QoE before closing,” you already know the feeling: confidence in your numbers, mixed with a quiet worry that something’s about to get found. Here’s the direct answer. A quality of earnings (QoE) analysis is an independent financial review, usually performed by a CPA firm or a due diligence specialist, that tests whether the profit your business reports is real, recurring, and likely to continue after a change of ownership. It’s not an audit. It’s not a single ratio. It’s a full investigation into the story your numbers are telling and whether that story holds up. Most e-commerce founders only encounter this concept once, right in the middle of a sale process, which is exactly the wrong time to be learning it for the first time. Why Your P&L Was Never Built for This Moment Your profit and loss statement exists to satisfy the IRS, not to convince a buyer’s investment committee. Those two audiences want opposite things. Your tax preparer wants taxable income as low as legally possible. A buyer wants to see the true, repeatable cash-generating power of the business, with anything that won’t carry forward once you’re gone stripped out. That gap between “tax return profit” and “sustainable operating profit” is exactly what a QoE engagement exists to close. The analyst takes your reported EBITDA and rebuilds it, adjustment by adjustment, until what’s left is a number a buyer can actually underwrite and pay a multiple on. What a Quality of Earnings Report Actually Covers A properly scoped QoE report typically includes: For an Amazon or Shopify seller, the add back schedule is usually where the real conversation happens. It’s common to see an owner’s personal vehicle lease, a family member’s salary for limited involvement, or a one time legal settlement running through the business. None of that makes the books wrong. It just means those amounts need to be identified, documented, and removed so a buyer sees the earnings the business would generate without the current owner’s personal arrangements attached to it. How the Analysis Actually Gets Done A QoE review is closer to an investigation than a read through of your financials. A reviewer will typically trace bank deposits against reported revenue, test whether returns and chargebacks were recorded in the period they actually occurred rather than lagging into the following month, and verify that cost of goods sold matches what actually moved through inventory. This last point catches a lot of multichannel sellers off guard. A brand running Shopify, Amazon, and a wholesale account often books COGS differently across each channel, sometimes because of how each platform reports fees and returns, sometimes because of inconsistent inventory costing methods. A reviewer will usually spot this within the first pass, because it shows up as a gross margin that moves around from month to month without an operational reason behind it. Amazon sellers specifically should expect scrutiny on: Quality of Revenue: The Analysis Buyers Weight Just as Heavily Earnings quality and revenue quality are related, but they’re not the same question. Quality of revenue asks something narrower and, for ecommerce specifically, often more important: is this revenue durable, or is it fragile. This typically means examining: Two businesses can post identical top line revenue and receive very different offers. A brand generating seven figures through one hero product sold almost entirely via paid social carries meaningfully more risk than a brand with a broader SKU mix, healthy repeat purchase rates, and organic search traffic doing real work. The Quality of Earnings Ratio Is a Different Tool, and Conflating the Two Is a Common Mistake This is worth being precise about, because a lot of content online blurs it. The quality of earnings ratio, sometimes called the quality of income ratio, is a standalone financial metric used in general financial statement analysis, not a summary formula for a QoE engagement. It’s calculated as: Cash Flow from Operations ÷ Net Income A ratio at or above 1.0 generally suggests reported earnings are backed by real cash movement. A ratio that sits meaningfully below 1.0 across multiple periods can indicate that net income is being influenced by timing differences, accruals, or accounting treatment rather than cash actually collected. This ratio is a useful diagnostic. It is not a substitute for a QoE analysis, and no legitimate due diligence provider would present it as one. A full QoE engagement examines add backs, revenue recognition, customer concentration, and working capital in detail, none of which a single ratio can capture. Think of the ratio as a smoke detector. A QoE report is the full inspection that follows if the alarm goes off, or in many deals, the inspection that happens regardless of what the ratio shows, because buyers want the complete picture either way. For ecommerce businesses, a large inventory purchase timed right before period end is a common reason this ratio looks weak even when the business is healthy. Net income can look fine on paper while cash flow tells a very different story that month. A Practical Quality of Earnings Checklist for Ecommerce Founders Whether you’re six months from a sale or just want your books defensible at any moment, this is the groundwork worth doing now rather than under deadline pressure. Financial records Revenue and margin Inventory Documentation A business that can produce clean answers to every item above isn’t just ready for a QoE. It’s running better day to day, which is usually the actual point. Where Quality of Earnings Fits in the Larger Due Diligence Process A QoE analysis is one component of a broader due diligence process that also includes legal review, operational assessment, and tax diligence, but it’s frequently the piece that determines whether a deal closes at the agreed price or gets renegotiated downward after the fact. Buyers commission it to protect their purchase price. Sellers who commission their own version first tend to walk
What a Financial Manager Does for Ecommerce Brands

Here’s the version nobody puts in the job posting: a financial manager’s job is to make sure you never get surprised by your own bank account. That’s it. Everything else the budgets, the forecasts, the KPI dashboards exists to serve that one outcome. For an e-commerce brand, “surprised by your bank account” usually looks like this: you’re profitable on paper, Shopify says margins are healthy, and then a supplier invoice or a payroll run lands, and there’s suddenly not enough cash to cover it. Nothing was wrong with the business. Nobody was watching the timing. That gap between what your P&L says and what your bank balance does is the entire reason this role exists. What a Financial Manager Actually Does Strip out the job-description filler, and a financial manager does three things: watches the money, plans around it, and reports on it in a way a busy founder can actually use in under five minutes. Watching the money means tracking cash flow weekly, not glancing at a bank balance and calling it a system. For a growing ecommerce brand, that’s the difference between assuming you can place the next inventory order and actually knowing it, three weeks before the PO is due. Planning around it means modeling the scenarios that actually hit e-commerce brands: what happens to margin if a supplier raises landed cost 8%, what a Q4 inventory buy does to your cash position heading into January, and whether a new SKU is worth the working capital it’ll tie up for 90 days before it sells through. This work overlaps heavily with what a fractional controller does in most small and mid-sized brands; the two roles blend together depending on who’s hiring and what they decided to call the position that week. Reporting means turning raw numbers into something an owner, lender, or investor can read once and act on. This is where e-commerce financial reporting gets genuinely different from generic small-business finance. You’re dealing with multichannel revenue, marketplace fee structures that shift without warning, and returns that distort a plain-vanilla P&L until you know what you’re looking at. If you’ve ever stared at a “profitable” month and still felt uneasy, that unease is worth listening to to see if your P&L is lying to you for what’s usually hiding in there. 5 Signs You’ve Outgrown Basic Bookkeeping A bookkeeper keeps an accurate record of what already happened. That’s valuable, and it’s also the ceiling of the role. If any of these sound familiar, you’ve hit that ceiling: Two or three of these, and you don’t need more bookkeeping. You need someone deciding what to do with the numbers, not just recording them. (For the mechanical difference between the two functions, see Bookkeeping vs. Accounting.) Case Study: How a 15% Marketplace Fee Drift Went Unnoticed Until Q4 Take a seven-figure brand selling across Shopify and Amazon, heading into Q4. With a bookkeeper only: Books are clean, reconciled, and accurate. Revenue is up 22% year-over-year going into November; everyone’s happy. What nobody catches is that Amazon quietly shifted referral fee tiers and added a new FBA surcharge that took effect in September. Combined with a rising return rate on the brand’s top-selling SKU, actual marketplace fees drifted about 15% higher as a share of revenue than the year before. The bookkeeper’s job was to record the transactions accurately, and it was done accurately. Nobody’s job was to ask whether the relationship between revenue and fees had changed. The brand finds out in January, during tax prep, when the accountant flags that net margin on Amazon revenue dropped nearly four points year-over-year. By then it’s a story about last quarter, not a decision that could’ve been made in October. With a financial manager or fractional controller in place: Weekly cash and margin monitoring flags the fee creep by the third week of September while there’s still time to act. The response is concrete: reprice two SKUs to absorb the new fee structure, shift ad spend toward the higher-margin Shopify channel for Q4, and rework the Q4 inventory buy to protect cash instead of chasing the same unit volume at a worse margin. Same business, same sales numbers. The difference isn’t the bookkeeping; it’s whether anyone was positioned to catch the drift while it was still fixable. That’s the entire value of the role in one example. 5 Ecommerce Financial KPIs a Bookkeeper Never Tracks A bookkeeper’s job stops at “Is this recorded correctly?” A financial manager tracks a different layer entirely the metrics that tell you what to do next: None of these show up in a standard bookkeeping report. All five are the actual inputs behind whether an e-commerce brand can fund growth without running out of runway. Financial Manager vs. Controller vs. Bookkeeper vs. CFO: What’s the Difference? Role Primary Focus Typical Scope Bookkeeper Recording transactions accurately Daily entries, reconciliations Financial Manager Planning, forecasting, strategic decisions Budgets, cash flow, investment calls, reporting Controller Accuracy and control over financial processes Closing the books, internal controls — fractional controller work CFO High-level strategy and capital decisions Fundraising, long-range strategy, board reporting In practice, these roles blur constantly under a few million in revenue. A lot of “financial manager” titles are really doing controller work. A lot of controllers are quietly doing financial-manager-level strategy because nobody else on a lean team is positioned to make the call. Titles are far less consistent than the actual work, which is exactly why hiring for a title instead of a function trips up so many founders. Inside a 7-Figure Ecommerce Brand: What This Role Looks Like Day to Day For a seven-figure brand selling across Shopify and Amazon, this isn’t a corporate treasury function. It’s making sure the business can fund a Q4 inventory order without straining payroll, knowing which SKUs are actually profitable after marketplace fees and returns, and catching a margin decline three weeks in, not three months later when the close finally surfaces it. That’s a meaningfully different job than
High Income Tax Strategies to Keep More of Your Business Profits

If your e-commerce business has moved from “doing well” to consistently generating six figures in profit, tax planning starts to look very different. At $50,000 of profit, finding legitimate deductions may be the priority. At $200,000, $300,000, or $400,000+, the bigger question becomes how your business structure, owner compensation, QBI deduction, retirement plan, equipment purchases, and estimated taxes work together. That distinction matters. The goal isn’t to make a profitable business look less profitable just to reduce a tax bill. It’s to make deliberate decisions about how and when income is taxed while keeping enough cash in the business to operate and grow. For e-commerce owners, this becomes even more important because profit can swing dramatically between quarters. A strong Q4 can look great on the income statement while creating a much larger tax obligation than expected. The strategies below are most useful when your business has reached the point where tax decisions need to be made throughout the year not reconstructed after the year is over. Why High Income Changes the Math Once your ecommerce business is consistently generating $150,000 to $300,000 or more in profit, tax planning becomes less about collecting receipts and more about coordinating decisions. Self-employment or payroll taxes can become a meaningful part of the picture, while deductions such as the Qualified Business Income deduction can become subject to additional limitations as taxable income rises. At this level, broader tax planning strategies should be part of your financial planning rather than something you revisit only when your tax return is being prepared. The important shift is from asking, “What can I deduct?” to ask: “How will this decision affect my total tax position?” Review Your Entity Structure If you’re consistently generating substantial profit as a sole proprietor or single-member LLC, it’s worth reviewing whether your current tax structure still makes sense. For some owners, an S corporation election can reduce employment-tax exposure by separating reasonable W-2 compensation from the corporation’s remaining profit. But an S corporation isn’t simply a way to choose a low salary and take everything else as distributions. An S corporation must pay reasonable compensation to a shareholder-employee for services performed before non-wage distributions are made. The IRS can reclassify payments as wages when compensation isn’t reasonable. Factors can include the owner’s duties, experience, time spent, responsibilities, and comparable compensation. For an e-commerce founder, that means looking at what you actually do. Are you running operations? Managing employees? Handling marketing? Overseeing purchasing? Managing fulfillment? Making strategic decisions? Your compensation should reflect the value of those services, not simply the number that produces the lowest payroll-tax bill. The bigger opportunity is to model the structure before year-end and see how salary, distributions, QBI, payroll taxes, and retirement contributions interact. That is where entity planning becomes more than a tax-form decision. Coordinate the QBI Deduction The qualified business income deduction can be valuable, but high-income owners shouldn’t treat it as an automatic 20% deduction. For 2026, the QBI deduction is permanent. The taxable-income threshold is $201,750 for most filers and $403,500 for married couples filing jointly. The phase-in ranges extend to $276,750 and $553,500, respectively. Once taxable income moves into the applicable ranges, wage and qualified-property limitations can affect the deduction. For a high-income ecommerce owner, the important point isn’t simply knowing that QBI exists. It’s understanding how business profit, taxable income, W-2 wages, qualified property, and entity structure interact. That’s especially important with an S corporation. Reasonable compensation reduces the business income flowing through as QBI, while W-2 wages can also become relevant when the wage-based limitation applies. In other words, S-Corp planning and QBI planning shouldn’t happen in separate conversations. If you need the detailed eligibility rules and calculation mechanics, see our guide to the QBI deduction. Use Retirement Plans Strategically Once business profit becomes substantial, retirement planning can become more than a personal wealth-building decision. It can become part of the business’s broader tax strategy. Depending on your structure and circumstances, options can include a 401(k), SEP IRA, defined-benefit plan, or cash-balance plan. For an owner consistently earning $400,000 or more, a cash-balance plan combined with a 401(k) may allow substantially larger contributions than a basic retirement arrangement alone. But the potential tax benefit needs to be weighed against administration costs, funding requirements, and the business’s long-term cash flow. S corporation owners also need to understand an important limitation: retirement-plan contributions are based on eligible compensation, not shareholder distributions. The IRS states that S corporation distributions do not constitute earned income for retirement plan purposes. That makes the relationship between reasonable salary, retirement contributions, payroll taxes, and QBI particularly important. The right question isn’t simply, “What’s the biggest retirement contribution I can make?” It’s: “What contribution strategy makes sense given my compensation, business profit, cash flow, and long-term goals?” Time Major Deductions Around Profit A large equipment purchase can create a significant deduction, but buying something solely because it produces a tax deduction is rarely a good strategy. Section 179 can allow qualifying property to be expensed rather than depreciated over multiple years. For 2026, the maximum Section 179 deduction is $2.56 million, with the deduction beginning to phase out once the cost of Section 179 property placed in service exceeds $4.09 million. Current law also provides 100% additional first-year depreciation for qualifying property acquired after January 19, 2025, subject to the applicable requirements. For e-commerce businesses, potentially relevant assets can include certain computers, warehouse equipment, machinery, and other qualifying business property. But here’s the part that matters for a high-income owner: A deduction isn’t automatically valuable just because it’s available today. If you’re having an unusually profitable year, accelerating a legitimate deduction may make sense. If this year’s taxable income is unusually low and next year’s projected income is much higher, preserving a deduction for a future year may sometimes produce a better overall result. That means major purchases should be evaluated alongside your projected profit, cash flow, and future tax position—not made solely because a deduction is available.